Android Toy

Overview
Product sourcing insights & recommendations
The 'android toy' market is currently shaped by two distinct segments: licensed mascot collectibles and AI-powered robotic toys that utilize the Android OS for control and interaction. While the classic "bugroid" mascot remains a niche favorite for adult collectors, the broader market is shifting toward sophisticated, emotionally intelligent companion robots.
Market Trends & Consumer Insights
* The "Kidult" & Collector Surge: Adult collectors now account for 25% of U.S. toy sales Licenseglobal. This fuels demand for premium "designer toys" like the Android mascot series and high-end AI companions.
* Growth Projections: The global smart toys market is expected to reach $44.0 billion by 2033, with a strong CAGR of 15.8% Grandviewresearch. Search interest in "android toy" peaked in June 2026, reflecting a 400% increase over early 2025 levels .
* AI Integration: Consumers are prioritizing embedded intelligence over app-dependent play. Popular products like Loona and Nebula Plush (integrated with GenAI) offer voice commands, gesture control, and emotional feedback GrandviewresearchToybook.
* Educational Sourcing: 60% of parents prioritize STEAM-related learning, driving a demand for programmable robots that connect to Android devices for coding education ParentsAmazon.
Top Product Categories
- 1Mascot Collectibles: Officially licensed Android mini-figurines (e.g., from Dead Zebra/Google) remain popular for desk decor and cross-brand collaborations MerchDeadzebra.
- 2AI Robot Pets: High-tech companions like the Loona Smart AI Pet feature remote monitoring and AI-driven personality Alibaba.
- 3Smart STEM Robots: Programmable kits and robotic puppies that support Android app-based action programming and voice recognition Alibaba.
Sourcing Landscape
Major manufacturers are concentrated in Guangdong, China, specializing in PVC figurines and electronic smart toys.
* Customization: Suppliers like Shenzhen Meiyan Technology offer ODM/OEM services for custom vinyl figurines and blind box series Alibaba.
* High-Tech Manufacturing: Vendors like Shenzhen Innoview Technology lead in producing complex AI-driven companion robots Alibaba.
Based on these trends, you can explore the following next steps:
Interactive Ai Robotic Pets Android Controlled
Products · 2 lists

Cute Pink-faced Smart Robot Pet | Desktop Interactive Electronic Companion Featuring AI Functions
 Lingheyun Intelligent Technology (suzhou) Co., Ltd.🇨🇳CN2 yrs
Original Loona Dogs Robot Toy Senior Ai Electron Pet Machine Voice Interactive Kids Smart Toys Emo Robot Dogs Support 9 Language
 Shenzhen Huchangshen Yang Electronic Technology Co., Ltd.🇨🇳CN3 yrs
Loona Smart AI Pet Robot With Gesture Control, Voice Commands, and Remote Monitoring
 Shenzhen Innoview Technology Co., Ltd.🇨🇳CN6 yrs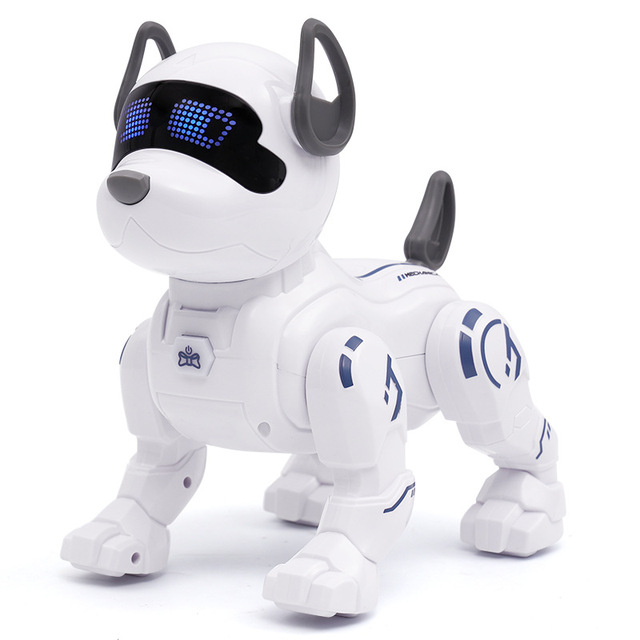
Smart Rc Robot Dog Toy for 2.4g Remote Control Interactive Walking Dancing Support Action Programming Ai
 Shantou Qiaobai Toys Co., Ltd.verified🇨🇳CN8 yrs
Smart Rc Robot Dog Toy for 2.4g Remote Control Interactive Walking Dancing Support Action Programming Ai
Related Searches
Explore more sourcing topics & related categories
Sources & References
27 sources cited · Verified industry data & reports
Today's Global Toy Trends
www.licenseglobal.com
As 2026 begins and the toy industry prepares for 2027 and beyond, toy makers continue to innovate and strategize for a volatile yet currently rising market. Tariff policy is seemingly shifting daily, resulting in uncertainty amongst industry leaders. Data shows, however, that there is hope for continued growth in the toy industry. In October, License Global reported the landmark toy deal between Netflix, Hasbro and Mattel for “KPop Demon Hunters,” allowing two major players to become co-master toy licensees. Powerful IP and speed to market are of top priority for these companies. “‘KPop Demon Hunters‘ is a powerful example of how stories can transcend mediums and inspire global fandom,” says Kim Boyd, president, licensing and entertainment, Hasbro. “It blends music, fashion and emotion in a way that connects across generations and geographies – the kind of world where Hasbro can extend the experience through play. In 2026, we’ll translate that creativity into a lineup featuring special-feature plush, youth electronics and role-play items, along with co-branded collaborations across Hasbro Games, Wizards of the Coast, NERF and FURBY. We just secured the co-master toy licensing rights for ‘KPop Demon Hunters’ for key categories including fashion dolls and collectibles, and it’s the perfect window into pop culture driving innovation. This is warp-speed for us and absolutely the fastest we’ve ever gone to market on an IP – moving quickly to give fans what they’re looking for.” · Movies are expected to be big in 2026 and 2027. “The consumer already has enough economic pressure on their shoulders, and you don’t want to take the magic out of the toy. You find ways to take other costs out of the product. Perhaps you can reconfigure the packaging, streamline your logistics and operations or think creatively about how to market the product. When these challenges hit us, the first thing we do is get creative, not to increase the price yet still deliver the magic. Well over 50% of our product line is under $20 despite the tariffs and we’re maintaining that as we head into 2026.”
Smart Toys Market Size And Share | Industry Report, 2033
www.grandviewresearch.com
Fastest-growing regional market: Asia Pacific (highest CAGR, 2026-2033) The smart toys industry in the U.S. held the largest revenue share in 2025. ... Parents today are actively seeking toys that offer more than entertainment, favoring products that can support learning outcomes, creativity, and structured development. According to The Toy Association’s Trend Spotting insights, 58% of U.S. Smart toys market size was valued at $14.4 billion in 2025 and is projected to grow from $15.7 billion in 2026 to $44.0 billion by 2033, at a CAGR of 15.8% The global smart toys market size was valued at USD 14.4 billion in 2025 and is projected to grow from USD 15.7 billion in 2026 to USD 44.0 billion by 2033, at a CAGR of 15.8% from 2026 to 2033. The market in North America dominated with a revenue share of 38.9% in 2025. The smart toys market in the Japan is expected to grow at a CAGR of 10.9% from 2026 to 2033. The market is driven by strong demand for robotics-based and interactive companion toys that align with the country’s high adoption of advanced technology and automation.
Toy & Play Trends - 2026 Toy & Play Trends
www.toyassociation.org
Teens and young adults (many of whom didn’t grow up with these toys) are tapping into cultural relics from decades past as a form of exploration, inspired by aesthetics, fashion, and social media. Reflecting this cultural appetite, Pinterest Predicts 2026 reported a 140% surge in searches for 2000s-era kids’ toys. Licensing now accounts for over one-third of all U.S. toy sales, underscoring just how central fandom has become to the category. From the FIFA World Cup and the 2026 Winter Olympics, to streaming hits, “memeable” moments, and viral fandoms, cultural touchpoints are driving toy momentum faster than the traditional movie-led cycle. This cultural shift is fueling demand for toys that encourage kids to put down their devices and become makers themselves. The global STEM toys segment is predicted to nearly double between 2024 and 2034 (market.us), and 78% of parents want more toys that help their kids develop skills like creativity and problem-solving, according to The Toy Association’s recent survey of U.S. Toys ignite a child’s imagination offering limitless possibilities. At The Toy Association, we track what’s happening in the toy business, in other industries, at retail, and with kids and families to uncover the hottest trends shaping how children like to play.
How Many Android Users in the World? (2026 Data)
www.demandsage.com
The following table displays the market share of the Android vendor market. ... As of June 2026, 2.36 million apps are available in the Google Play Store. Android continues to dominate mobile usage in 2026, with 3.9 billion users, a 68% global share, and a leading presence across major markets. Naveen’s attention to detail ensures that his content remains accurate and relevant, offering valuable guidance for professionals seeking data-backed information. His expertise spans various topics, from digital marketing trends to emerging technologies, making his contributions essential for anyone looking to stay ahead in data-driven decision-making. Here is a table displaying the market share of Android Vs iPhone in the United States. Source: StatCounter. With 31.5% of the mobile vendor market share, Samsung is the leading Android vendor worldwide.
Circana 2026 Global Toy Report: Market Forecasts & Industry Trends
www.circana.com
Circana's 2026 Global Toy Report is here. Get the forecasts, regional breakdowns, and industry trends shaping the next phase of global toy market growth. Download the full report. The 2026 Global Toy Report delivers the insights behind the headlines—from regional growth shifts to evolving consumer demand—helping manufacturers and retailers uncover where the biggest opportunities are emerging. The report provides a complete view of the $123B global toy market, including: Liquid Data Go® helps growing CPG brands show their value with insights into performance, consumer behavior, e‑commerce trends, and pricing across key retailers. ... It’s time to move beyond disconnected insights and delayed decisions into a new era for media, together. ... Pokémon continues to drive cross-category growth. ⚡ · In 2024, Pokémon Scarlet and Violet led the franchise in dollar sales. In 2025, Pokémon ranked as the #1 toy property in 9 of the 12 countries we track. Consumer insights and buying trends.
Android Device Brands Market Share in 2026
telemetrydeck.com
This chart shows the top 10 Android Device Brands for each week. Values are percentages. Download as Image Download as CSV for Excel Download as JSON ... samsung was the most used device brand in our data as of end of May 2026 with a share of 49.07%. The share has dropped a bit lately and consequently in April was at under 50% for the first time in 12 months. The share of Redmi has decreased considerably since the middle of 2025, when it was at over 14%. It was at 5.39% at the end of May 2026. How to invite members to your organization Quick set-up for your MAU insights Making an account Namespaces Navigation Events A Practical Guide to Notebooks Setting Up the 'Errors' Preset to Reduce Churn Setting Up the 'Purchases' Preset to Get Live Purchase Data Filters - How to use the Filter Editor TelemetryDeck Swift Client Reference Getting started with Test Mode Funnels - How they work Hosting Solutions at TelemetryDeck How to login to TelemetryDeck Track the number of daily users in your app How to update a Swift package Find out which operating system your users are using Picking your minimum iOS or Android version Detect if users update to the latest app version How to write this Documentation Ultra-quick Setup Visual Query Editor Funnels Custom Dashboards Cookieless Tracking See all features iOS, macOS, visionOS Android and Kotlin React Native Flutter Websites See all platforms